Most WordPress site owners manage security the same way they manage their car — they ignore it until something goes wrong.
The firewall is running. The malware scanner is active. The login limiter is in place. But what is actually happening on the site right now? Which countries are the requests coming from? Is that sudden spike in traffic a genuine surge of visitors, or is something scanning your site for vulnerabilities? Did that request that just hit your contact page get blocked — or did it go through?
Without visibility into live traffic, security is blind. You are relying entirely on automated tools to catch threats, with no way to see what those tools are seeing or whether they are doing their job.
UltraGuard’s Live Traffic Monitor solves this. It captures every request that hits your site, classifies it in real time, and presents it in a dashboard that updates automatically every 10 seconds. You can watch threats be identified, see blocked requests as they happen, investigate suspicious IP addresses, and take instant action — all from a single page.
It is one of the most compelling features in the entire plugin, and it is completely free.
What the Live Traffic Monitor Does
At its core, the Traffic Monitor is a real-time request log. Every time someone — or something — makes an HTTP request to your WordPress site, UltraGuard captures it, analyses it, and stores it in the database with a full set of details:
- IP address of the visitor
- Country, country name, and city resolved from the IP using geolocation
- HTTP method (GET, POST, PUT, etc.)
- Request URI — the exact URL that was requested
- User-Agent — the browser or tool that made the request
- Referrer — where the visitor came from
- Response code — what your server sent back
- Threat type — what kind of attack was detected, if any
- Threat level — none, low, medium, high, or critical
- Was it blocked? — did the firewall stop it?
- Is it a bot? — is this automated traffic?
Every request. Every page. Every endpoint. All of it, captured and searchable.
How Threat Classification Works
The most powerful aspect of the Live Traffic Monitor is not just that it records requests — it is that it understands them. Every request is automatically classified before it is stored, using the same analysis engine that runs across your WAF and firewall.
The Six Threat Types
Clean — a normal, legitimate request with no suspicious characteristics. A visitor browsing your homepage, a search engine indexing your content, a customer viewing a product page. These are shown in green in the dashboard.
Brute Force — a POST request to wp-login.php. Any POST to the login page is classified as a potential brute-force attempt, regardless of whether it succeeded. This lets you see exactly how many automated login attempts your site is receiving in real time.
SQL Injection (SQLi) — a request whose URL or query string contains SQL patterns: UNION SELECT, SELECT FROM, SLEEP(), BENCHMARK(), information_schema, or OR 1=1. These are the signatures of database attack attempts.
Cross-Site Scripting (XSS) — a request containing script injection patterns: <script, URL-encoded %3Cscript, event handlers like onerror= or onload=, or javascript: protocol strings. These are attempts to inject malicious JavaScript into your site.
Scanner — a request from a known vulnerability scanning tool. User-agent strings from sqlmap, nikto, masscan, zgrab, nmap, nuclei, gobuster, dirbuster, and acunetix are classified as critical-severity scanners. These are the tools attackers use to map your site and find vulnerabilities.
Spam — a request to a comment or contact endpoint with spam-related keywords in the query string — terms like viagra, casino, seo, backlinks. These are automated spam submissions.
Threat Levels
Each classified request also receives a threat level:
| Threat Type | Threat Level |
|---|---|
| Clean traffic | None |
| Brute force login attempt | Medium |
| SQL injection | High |
| XSS attempt | High |
| Known scanner (sqlmap, nikto, etc.) | Critical |
| Spam submission | Low |
High and critical threats can optionally trigger the auto-block system, escalating from monitoring to active defence automatically.
The Dashboard: What You See
When you open UltraGuard → Traffic Monitor, you see four sections immediately.
Stat Cards — The 24-Hour Summary
Four numbers at the top give you an instant picture of your site’s last 24 hours:
Total Requests — the raw count of all requests captured in the past 24 hours. This includes clean traffic, bots, and threats.
Threats — the number of requests classified as any threat type (anything other than clean). The card turns amber when threats are detected, green when the count is zero.
Blocked — the number of requests that were actively blocked — by the firewall, by login limiter lockouts, or by the traffic monitor’s own auto-block system. The card turns green when blocking is working, grey when nothing has needed blocking.
Unique IPs — the count of distinct IP addresses seen in the past 24 hours. A sudden spike in unique IPs often indicates a distributed attack or bot swarm.
Traffic Timeline Chart
A line chart showing requests over the past 24 hours, hour by hour, split into two series: clean traffic (green) and threatened traffic (red). This makes the relationship between legitimate and malicious traffic immediately visible.
A normal site shows a clean traffic curve that rises during business hours and falls overnight, with occasional low spikes of threats. A site under attack shows a sudden spike in the red line — a surge of threat traffic that stands out immediately from the normal pattern.
Top Threat Types Pie Chart
A pie chart breaking down the distribution of threat types across the 24-hour window. If 80% of your threats are scanner, that tells you an automated tool is probing your site. If most are brute_force, you are seeing a password attack. If you see sqli, someone is testing your database endpoints.
The type breakdown helps you understand the nature of the attack, not just the volume.
Top Source Countries
A ranked list of the top 10 countries sending traffic to your site in the past 24 hours, shown as progress bars with the country flag, name, code, request count, and percentage share of total traffic.
This is genuinely eye-opening for most site owners. The geographical source of attack traffic is often very different from the source of legitimate visitors — a UK-based blog might have 90% of its legitimate visitors from the UK but receive attack traffic predominantly from overseas. The country breakdown makes this pattern immediately visible.
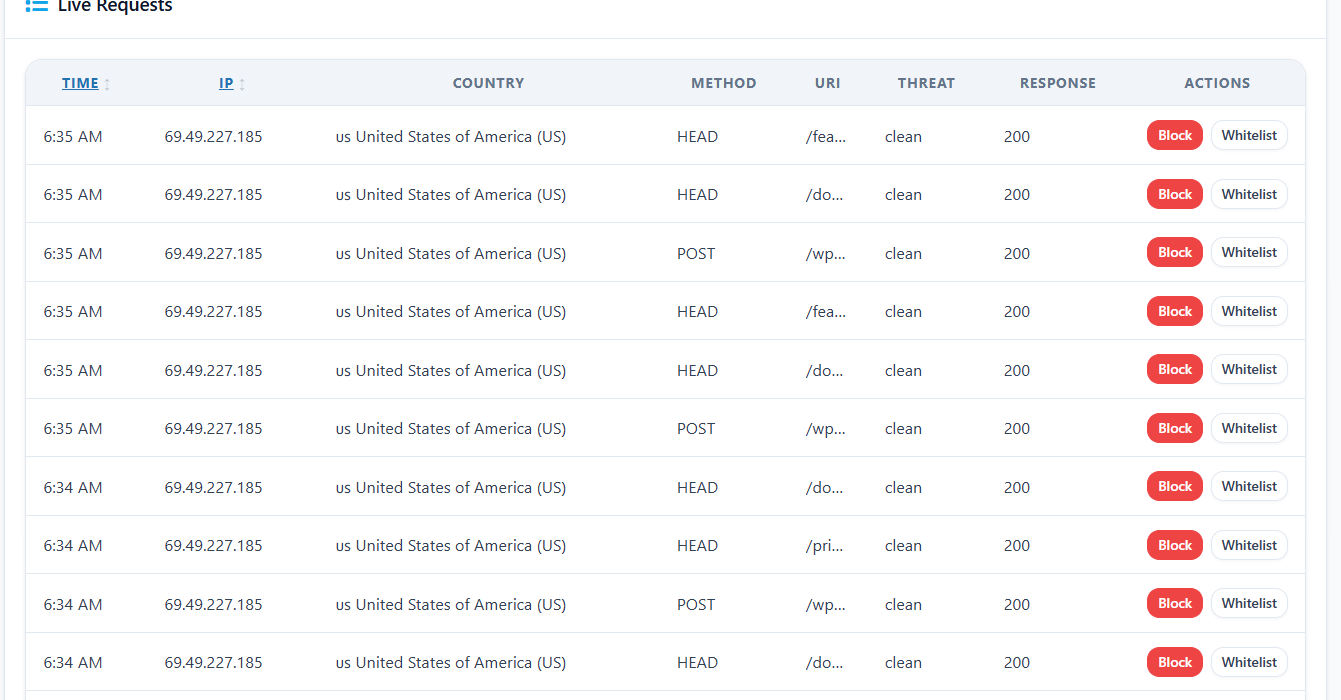
The Live Traffic Table
Below the charts is the real-time traffic log — a searchable, filterable table of the most recent requests, updated automatically every 10 seconds.
Each row shows:
- IP address — the source IP, with a one-click block button
- Country flag and code — where the request came from geographically
- Method and URI — exactly what was requested
- User-Agent — the browser or tool that made it
- Threat type badge — colour-coded: green for clean, amber for medium, red for high/critical
- Blocked indicator — whether the request was stopped
- Timestamp — when it arrived
One-Click IP Blocking
Every row in the traffic table has a Block IP button. One click adds that IP address to the firewall blacklist — all future requests from that address are blocked immediately, without you needing to navigate to a different page or go through any confirmation flow.
This is the feature that makes the Live Traffic Monitor an active security tool rather than just an observation tool. You see a suspicious IP making repeated requests to sensitive endpoints. You click Block. It is gone. The entire action takes two seconds.
A Whitelist IP button is also available for marking trusted IPs so they are never flagged or blocked regardless of their request patterns.
Filtering the Traffic Feed
The Live Controls panel above the table lets you filter the feed to exactly what you need:
Filter by IP address — type any IP (or partial IP) to see only requests from that address. Essential when investigating a specific suspect.
Filter by Threat Type — choose from All, Clean, Brute Force, SQLi, XSS, Scanner, or Spam. Filtering to just scanner shows you every automated probe request from vulnerability scanning tools. Filtering to sqli shows every SQL injection attempt.
Filter by Date Range — specify a date from and date to for historical investigation. Pro users can query the full log history; free users see the most recent 200 requests.
Blocked Only — toggle this to see only the requests that were actually blocked, hiding all clean traffic. Useful when you want to verify your defences are working.
Auto-refresh toggle — the table refreshes every 10 seconds by default. You can disable this if you want to examine the current state without the view changing.
Auto-Block: From Monitoring to Active Defence
The Live Traffic Monitor does not just watch — it can act. When auto-blocking is enabled, the monitor automatically passes high-severity threat IPs to the Firewall module for blocking when they exceed a configured threshold.
How Auto-Block Works
Every time a request is classified as High or Critical severity, the monitor checks how many threatening requests have come from that IP address in the current hour. If the count reaches your configured threshold (default: 5), the IP is automatically blocked via the firewall.
The auto-block fires an action (ultraguard_pro/traffic_monitor/block_ip) that the Firewall module’s IP blacklist picks up — the same mechanism used by the Firewall’s own auto-ban feature. The result is a permanent entry in the firewall blacklist, blocking all future requests from that IP across your entire site.
Configuring Auto-Block
Auto-block threshold per hour (default: 5) — the number of high-severity requests from a single IP within the current hour before the block is applied.
Threat types to auto-block — you choose which threat types trigger auto-blocking. The defaults are: SQL Injection, XSS, Scanner, and Brute Force. Spam is excluded by default because spam volume can be high from otherwise benign IPs. You can customise this list to include or exclude any type.
For example: if you set the threshold to 3 and include “Scanner” in the auto-block types, the third request from a scanner IP within an hour triggers an automatic permanent block. No manual intervention needed.
Geolocation: Where in the World Are They?
Every IP address captured by the Traffic Monitor is resolved to a country, country name, and city using geolocation. The resolution uses a layered approach:
First, it checks for a locally installed MaxMind GeoLite2 City database — if you have installed the GeoLite2 MMDB file on your server, UltraGuard uses it directly with no external API calls. This is the fastest and most private option.
If the local database is not available, UltraGuard falls back to an external IP geolocation API. Geo data is cached so repeat requests from the same IP do not re-trigger the lookup.
If some historical records are missing geo data, the monitor automatically backfills them when the stats view is loaded — filling in country and city information for previously unresolved IPs without requiring a new request.
This geolocation data feeds the Top Source Countries chart, each request row in the table, and is available for filtering and investigation.
Log Retention and Data Management
Traffic logs are stored in your WordPress database in UltraGuard’s dedicated ultraguard_traffic_logs table. A daily cron job automatically prunes records older than your configured retention period.
Retention period (default: 7 days, maximum: 90 days) — traffic is high volume, so shorter retention keeps your database size manageable. 7 days is enough for most security investigations. Pro users who need longer-term analysis can extend this up to 90 days.
A Clear Logs button is available in the dashboard header to delete all traffic logs immediately if you want to start fresh.
Pro users can also Export CSV — downloading the full filtered traffic log as a CSV file for offline analysis, incident response documentation, or importing into other tools.
What Gets Ignored
Not every request needs to be in the traffic log. The monitor has sensible defaults for what to skip:
Logged-in administrators (default: skipped) — your own activity navigating the WordPress admin, saving posts, and managing settings does not pollute the traffic log with noise. Requests from logged-in users with manage_options capability are filtered out by default.
Localhost requests (default: skipped) — requests from 127.0.0.1 and ::1 are filtered out by default. These are internal server requests that are not real visitor traffic.
Custom ignored User-Agents — enter any User-Agent strings you want to exclude from logging, one per line. Useful for skipping monitoring tools, uptime checkers, or your own internal crawlers that you know are legitimate.
Custom ignored URI patterns — enter URL patterns to exclude from logging, one per line. Useful for skipping high-volume but uninteresting endpoints like /wp-cron.php, favicon.ico, or specific API routes that you know are always clean.
All Settings at a Glance
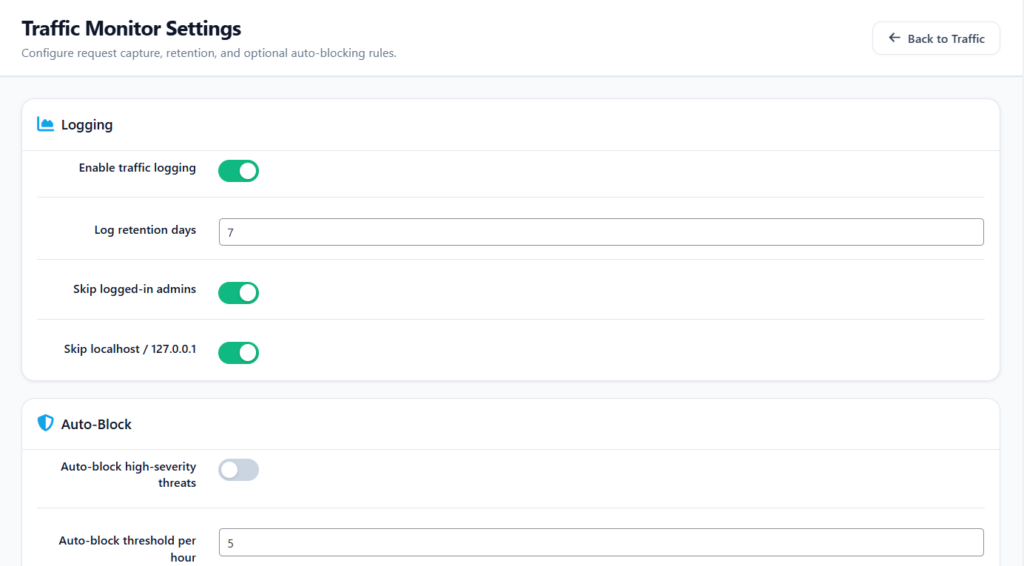
Logging Settings
| Setting | What It Does | Default |
|---|---|---|
| Enable Traffic Logging | Master toggle for the entire module | On |
| Log Retention Days | Auto-prune logs older than this (1–90) | 7 days |
| Skip Logged-in Admins | Exclude admin-user requests from the log | On |
| Skip Localhost | Exclude 127.0.0.1 / ::1 requests | On |
Auto-Block Settings
| Setting | What It Does | Default |
|---|---|---|
| Auto-block High-Severity Threats | Automatically block IPs exceeding threshold | Off |
| Auto-block Threshold Per Hour | Hits before block is triggered | 5 |
| Threat Types to Auto-block | Which types trigger auto-blocking | SQLi, XSS, Scanner, Brute Force |
Ignore Rules
| Setting | What It Does |
|---|---|
| Ignored User-Agent Patterns | User-agents to exclude (one per line) |
| Ignored URI Patterns | URLs to exclude (one per line) |
Free vs Pro
The Live Traffic Monitor is a free module — available to all UltraGuard users with no time limit.
Free includes:
- Full real-time traffic capture and classification
- All threat types (Clean, Brute Force, SQLi, XSS, Scanner, Spam)
- 24-hour stat cards, timeline chart, threat type pie chart, and country breakdown
- One-click IP blocking and whitelisting from the traffic table
- Auto-block system
- 7-day log retention
- Geo-resolution for every IP
Pro adds:
- Extended log retention up to 90 days
- Date-range filtering for historical investigation beyond the 7-day window
- CSV export for incident response and offline analysis
- Unlimited traffic history access
For most site owners, the free tier provides everything needed to monitor and respond to live threats in real time. Pro is most valuable for agencies and compliance-focused sites that need historical records for investigation or reporting.
Why Real-Time Visibility Changes Everything
Most security tools work in the background, silently blocking and logging without giving you any window into what they are doing. You know something is happening only when things go wrong — when a site gets compromised, when Google sends a warning, when a customer reports a problem.
The Live Traffic Monitor flips this model. Instead of finding out about attacks after the fact, you can watch them in real time. You can see a SQL injection attempt hit your site and be blocked. You can see a scanner working through your URLs and block its IP before it finishes mapping your site. You can see an unusual spike in traffic from a country you do not normally receive visitors from, and investigate immediately.
This visibility does not replace your automated defences — the firewall, the malware scanner, the login limiter. It sits alongside them and makes them transparent. Security stops being a black box and starts being something you can actually observe and understand.
That is why, despite being one of the simpler modules in UltraGuard, the Live Traffic Monitor is often the first one site owners open when they log in.
Download UltraGuard Free → View All Features →
UltraGuard Live Traffic Monitor is part of the free core of UltraGuard Security Suite v6.7.2. Requires WordPress 5.6+ and PHP 8.1+. Extended log retention, date-range filtering, and CSV export require a Pro or Agency licence.